Companies using Dynamic Graphics
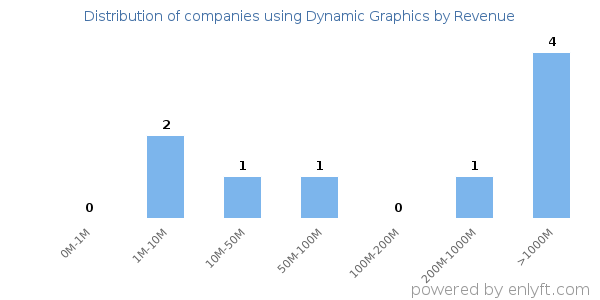
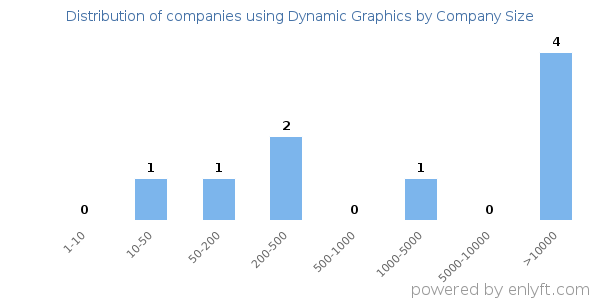
We have data on 9 companies that use Dynamic Graphics. The companies using Dynamic Graphics are most often found in United States and in the Oil & Energy industry. Dynamic Graphics is most often used by companies with >10000 employees and >1000M dollars in revenue. Our data for Dynamic Graphics usage goes back as far as 9 years and 4 months.
If you’re interested in the companies that use Dynamic Graphics, you may want to check out Autodesk AutoCAD and Dassault SolidWorks as well.
Who uses Dynamic Graphics?
| Company | Tracerco |
| Website | tracerco.com |
| Country | United Kingdom |
| Revenue | 200M-1000M |
| Company Size | 200-500 |
| Company | BP PLC |
| Website | bp.com |
| Country | United Kingdom |
| Revenue | >1000M |
| Company Size | >10000 |
| Company | Chevron Corporation |
| Website | chevron.com |
| Country | United States |
| Revenue | >1000M |
| Company Size | >10000 |
| Company | Dynamic Graphics |
| Website | dgi.com |
| Country | United States |
| Revenue | 1M-10M |
| Company Size | 50-200 |
| Company | Santa Monica College |
| Website | smc.edu |
| Country | United States |
| Revenue | 50M-100M |
| Company Size | 1000-5000 |
| Company | Website | Country | Revenue | Company Size |
|---|---|---|---|---|
| Tracerco | tracerco.com | United Kingdom | 200M-1000M | 200-500 |
| BP PLC | bp.com | United Kingdom | >1000M | >10000 |
| Chevron Corporation | chevron.com | United States | >1000M | >10000 |
| Dynamic Graphics | dgi.com | United States | 1M-10M | 50-200 |
| Santa Monica College | smc.edu | United States | 50M-100M | 1000-5000 |
Target Dynamic Graphics customers to accomplish your sales and marketing goals.
Dynamic Graphics Market Share and Competitors in Computer-aided Design & Engineering
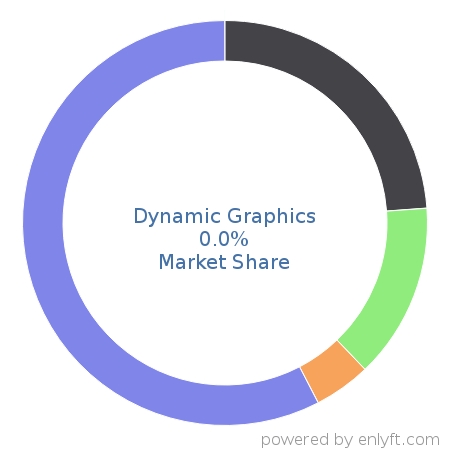
We use the best indexing techniques combined with advanced data science to monitor the market share of over 15,000 technology products, including Computer-aided Design & Engineering. By scanning billions of public documents, we are able to collect deep insights on every company, with over 100 data fields per company at an average. In the Computer-aided Design & Engineering category, Dynamic Graphics has a market share of about 0.1%. Other major and competing products in this category include:
Computer-aided Design & Engineering

What is Dynamic Graphics?
Dynamic Graphics, Inc. partners with its clients to solve spatial analysis problems in the petroleum, environmental, and earth-related sciences. Over the past four decades, they have been the premier provider of geospatial solutions with innovative, easy-to-use software and outstanding support services.
Top Industries that use Dynamic Graphics
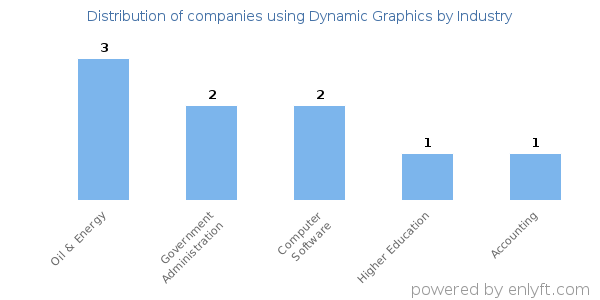
Looking at Dynamic Graphics customers by industry, we find that Oil & Energy (24%), Government Administration (13%) and Computer Software (13%) are the largest segments.
Top Countries that use Dynamic Graphics
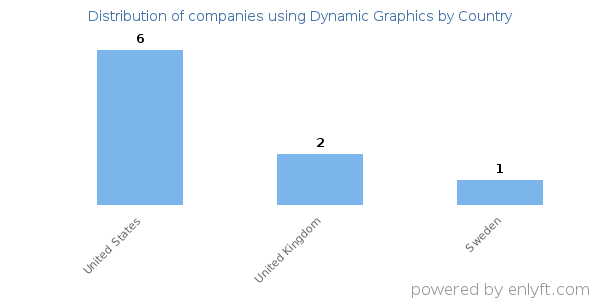
59% of Dynamic Graphics customers are in United States and 15% are in United Kingdom.
Distribution of companies that use Dynamic Graphics based on company size (Employees)
Of all the customers that are using Dynamic Graphics, 2% are small (<50 employees), 15% are medium-sized and 38% are large (>1000 employees).
Distribution of companies that use Dynamic Graphics based on company size (Revenue)
Of all the customers that are using Dynamic Graphics, 13% are small (<$50M), 0% are medium-sized and 36% are large (>$1000M).
