Companies using Splunk User Behavior Analytics
We have data on 170 companies that use Splunk User Behavior Analytics. The companies using Splunk User Behavior Analytics are most often found in United States and in the Information Technology and Services industry. Splunk User Behavior Analytics is most often used by companies with >10000 employees and 1M-10M dollars in revenue. Our data for Splunk User Behavior Analytics usage goes back as far as 2 years.
If you’re interested in the companies that use Splunk User Behavior Analytics, you may want to check out Proofpoint and Cookie Consent by Osano as well.
Who uses Splunk User Behavior Analytics?
| Company | Accenture PLC |
| Website | accenture.com |
| Country | Ireland |
| Revenue | >10B |
| Company Size | >10000 |
| Company | Cognizant Technology Solutions Corp |
| Website | cognizant.com |
| Country | United States |
| Revenue | >10B |
| Company Size | >10000 |
| Company | Infosys Ltd |
| Website | infosys.com |
| Country | India |
| Revenue | >10B |
| Company Size | >10000 |
| Company | International Business Machines Corporation |
| Website | ibm.com |
| Country | United States |
| Revenue | >10B |
| Company Size | >10000 |
| Company | Amazon.com, Inc. |
| Website | amazon.com |
| Country | United States |
| Revenue | >10B |
| Company Size | >10000 |
| Company | Website | Country | Revenue | Company Size |
|---|---|---|---|---|
| Accenture PLC | accenture.com | Ireland | >10B | >10000 |
| Cognizant Technology Solutions Corp | cognizant.com | United States | >10B | >10000 |
| Infosys Ltd | infosys.com | India | >10B | >10000 |
| International Business Machines Corporation | ibm.com | United States | >10B | >10000 |
| Amazon.com, Inc. | amazon.com | United States | >10B | >10000 |
Target Splunk User Behavior Analytics customers to accomplish your sales and marketing goals.
Splunk User Behavior Analytics Market Share and Competitors in Data Security
We use the best indexing techniques combined with advanced data science to monitor the market share of over 15,000 technology products, including Data Security. By scanning billions of public documents, we are able to collect deep insights on every company, with over 100 data fields per company at an average. In the Data Security category, Splunk User Behavior Analytics has a market share of about 0.1%. Other major and competing products in this category include:
Data Security

What is Splunk User Behavior Analytics?
Splunk User Behavior Analytics (Splunk UBA) is a machine learning driven solution that helps organizations find hidden threats and anomalous behavior across users, devices and applications. Its data science driven approach produces actionable results with risk ratings and supporting evidence, augmenting SOC analysts' existing techniques. It helps protect against unknown threats with user and entity behavior analytics.
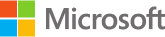
Top Industries that use Splunk User Behavior Analytics
Looking at Splunk User Behavior Analytics customers by industry, we find that Information Technology and Services (48%) and Computer & Network Security (5%) are the largest segments.

Top Countries that use Splunk User Behavior Analytics
68% of Splunk User Behavior Analytics customers are in United States and 5% are in India.

Distribution of companies that use Splunk User Behavior Analytics based on company size (Employees)
Of all the customers that are using Splunk User Behavior Analytics, 22% are small (<50 employees), 36% are medium-sized and 37% are large (>1000 employees).
")
Distribution of companies that use Splunk User Behavior Analytics based on company size (Revenue)
Of all the customers that are using Splunk User Behavior Analytics, 40% are small (<$50M), 16% are medium-sized and 11% are large (>$1000M).